"You can check out another *nice* milestones piece, from the first time the Dow crossed 1000 points in 1972 to present day. 1000 point milestones of The Dow, and then a table for ease of use The Dow's milestones. Just inside of 15 years to double from 1000 to 2000 points. From 2000 to 4000 took less than 8 years. From 4000 to 8000 took only two and a half years, those were the go-go days my friends. From 8000 to 16000 took over 16 years."
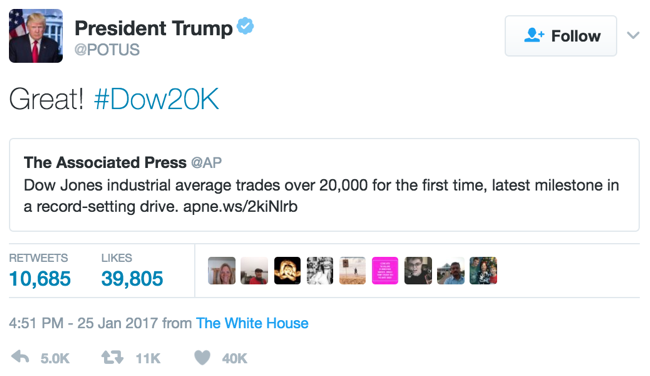
To market to market to buy a fat pig It is YUGE, it is amazing, everyone is amazed. I have a lot .... a lot of friends who think this is the biggest, the best and the greatest milestone of equity markets. This is tremendous, I have seen thousands (of points) of milestones, this is unbelievable. We are not weak, stupid or losers, nor are we morons, we are smart, very, very smart. Amazing, huge, tremendous. 20 thousand finally arrived for the Dow Jones Industrial Average, the index of 30 of the chosen stocks has more than tripled from the dark days of March the 6th 2009. That is right, tripled from then. To double from when the index first crossed the 10 thousand mark, on the 29th of March 1999 took 6513 days (including the starting and ending day). That is not tremendous.
Who else other than the people who are responsible for the data to celebrate and give you a whole lot of facts - The Dow and the world around it, then and now. Cher was a believer, Justin loved himself, like Cher. What a coincidence! The best fact of all is that Bill gates was the richest on the Fortune 400 back in 1999, he still is. What is hardly believable is that he is worth less on paper today than he was back then, in part as he has given some of that wealth away. To needy causes.
You can check out another *nice* milestones piece, from the first time the Dow crossed 1000 points in 1972 to present day. 1000 point milestones of The Dow, and then a table for ease of use The Dow's milestones. Just inside of 15 years to double from 1000 to 2000 points. From 2000 to 4000 took less than 8 years. From 4000 to 8000 took only two and a half years, those were the go-go days my friends. From 8000 to 16000 took over 16 years.
See how the components have changed over time - Ins & Outs. The last shuffle was done March the 19th 2015. What I find most incredible however is that there was a single fellow, by the name of Arthur "Pop" Harris, who spent 40 years on the job as an employee of the Dow Jones News Service, calculating the level of the index, on the hour every hour. From this section on the special of Dow 20 thousand - How the Dow Works:
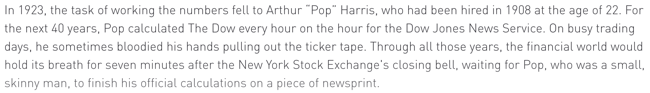
Whilst GE has been in the Dow most of the time since 1896, Pop Harris was more synonymous with the Dow for four decades. We all learnt something new today, at least I did. Lastly, scroll through the Sizzlers and Fizzlers. If you have been invested for a decade or more, scroll through the Top Daily % Losses and also Gains, see if you recognise those 5 moments, out of 40 in total. 12.5 percent of all the top highs and lows happened in that post Lehman period, another reminder that those were dark (very) days. 2008 was also the third worst year, percentage wise, on record. That bleak year saw the Dow sink 33.84 percent. The S&P 500 had a shocker that year too, down 38 and a half percent. 2008 was bad, very bad.
OK, history lesson over. Dow 20K has been reached, breached and is now a new level. 20068.51 was the closing level last evening, the intraday all time high is 20082. 2 minutes into trade was when the milestone was reached. As some dumb graph pointed out, each 1000 points added from here will reflect a smaller percentage gain. Last question, is it cheap or expensive? It does not matter what the level is, what are the valuations? Well, luckily there are resources for that - P/Es & Yields on Major Indexes.
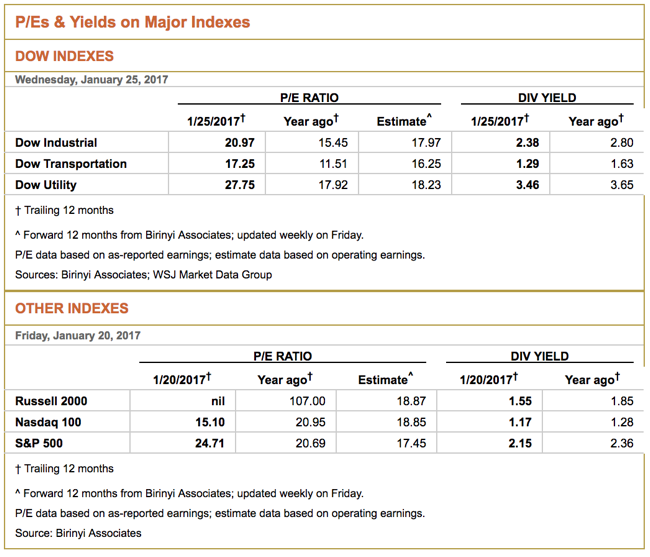
The "other" indices also hit all time highs. True story. The nerds of NASDAQ closed up nearly a percent to 5656, the broader market S&P 500 added four-fifths of a percent to 2298, which is two points away from the Goldman Sachs 2017 target. Which means very little to me, market strategists. Eish, one shouldn't be like that.
Company Corner
JnJ reported their full year and 4Q numbers on Tuesday before the US market opened. Off the bat the market wasn't impressed with the forecasted numbers for the coming year, with the stock dropping 2%. The drop highlights how stock prices are current expectations of future profits.
Onto the numbers, sales grew by 2.6% to $71.9 billion for the FY, most of the growth came from the US where sales grew by 6%. On the international side, sales dropped by 0.9% mostly due to a stronger dollar. Earnings grew 7.6% to $18.8 billion for the FY. Thanks to less shares in issue EPS was up 8.5%. So not a small company by any measure. The reason for small top line growth but stronger bottom line growth is due to cost cutting on the "selling, marketing and administrative costs" segment.
The main thing that I think is attractive about the company is that it is 3 businesses in one company. Their main business is their Pharma division which had sales of $33.5 billion, growth of 7.4% and profits of $13.1 billion. Next in line is their Medical Devices business which had sales of 25.1 billion, small growth of 0.9% and $8.1 billion in profits. Then lastly is their consumer division which had sales of $13.3 billion, growth of 1.5% and profits of $2.6 billion. The strongest growing segment of the consumer division was Beauty which grew at 9.4%.
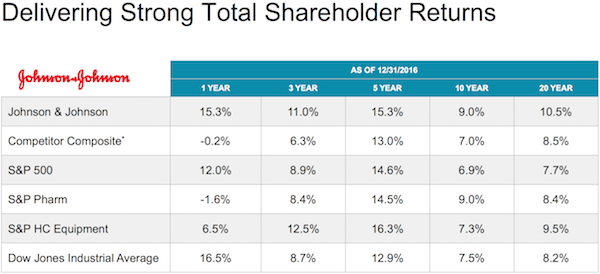
JnJ is one of those companies that ticks all the boxes. It covers healthcare, it covers new technology, it covers consumer products and it is an international player. Given its huge size the growth rates are never going to be eye watering but its size brings diversity and stability. Courtesy of the company here is how shareholders have done over the years. Still a buy in our books.
There was an industry insider who answered our message two days ago - Expect Analysts to Expect
"The reason for the beat/miss part that makes all the big headlines is that as you know valuation is ultimately driven by expectations of future cash flows, of which future earnings estimates is a driver (well at least a proxy). The "market's expectations" of earnings estimates will hence drive the share price. The market's expectations are a function of analysis, discussion with management and debate within the industry (for example between the sell side and the buy side) hence while far from perfect, are as close as the collective can get to future expectations based on "reasonable" assumptions.
I think the point is that the market is pricing in the average of expectations, whether the company likes it or not and whether they are right or not and therein lies the relevance of actual vs expected. Therefore I think it's fair to define the actual result as a beat or a miss because that's what it is, relative to expectations (because expectations, like it or not, are effectively "in the price").
I think where I agree with you strongly is on a lot of market commentators relying just on whether it's a beat or a miss and not looking at the underlying reason which is obviously way more important. If Apple miss earnings because a one off drought in China that hurt disposable income in a big region or something i.e. a one-time impact this would be irrelevant (despite the big headline MISS) vs. if volumes are in what looks like a structural decline clearly the tone of the story/headline should be different.
As a disclaimer I am in the industry hence do the excel earnings rodeo. And I'll be the first to admit getting it 100% right is a rare experience!
To which I replied:
1) Your profession is one that requires exceptional insight, you cannot be in your position without being at the top of your game. Your skills in actually picking the stocks is underutilized in the investment game, more research analysts should be portfolio managers is what I am trying to say.
2) I know that ultimately it depends on what the market is willing to pay today, based on the news we have, and the ability to predict (as much as three years forward) what sales, margins and earnings are likely to be, that is how the price is set.
3) Some stock prices are perpetually cheap or expensive, and applying one earnings litmus metric across the board is wrong. Luckily in recent years I have seen a change away from this practice. This then makes it harder to predict which stock in which industry is relatively cheaper or more expensive.
You are amongst the smartest people in the industry and are forced to stick your proverbial member on the block, and all the industry cares about is what price you set. I would prefer a third party independent view of what they think the company is likely to do over a longer period of time, thus setting yourself up for fewer potentially embarrassing moments, that need not arise.
Some stocks that the industry gets wrong almost all of the time include (by no means comprehensive), Amazon, Facebook, Capitec, Tesla ... there are many. Anglo recently? Naspers? The market gets it right and wrong almost all of the time. Setting yourself a target price over 12 months seems more like a lottery to me. Smart people forced to conform to a norm, with a multitude of unknown factors.
Enjoy, these too and fro emails are always useful to the general public! He replied, I shall leave it there:
"Agreed re:12 month targets and I think most of our clients largely look past these anyway and are generally more interested in long term thematic views. In fact the feedback we're getting as an industry is that we shouldn't even bother with results notes but focus on long term thought pieces, which makes more sense to me as well. The 12 month target obviously does try and capture the long term themes as most of us use a DCF for valuation (well we do certainly) rather than multiples but clearly trying to pinpoint an exact price on an exact date is going to be more than a little tricky. I think it's more the media that likes the beat/miss story which I guess is what a lot of Vestact's client base see (and panic over I'm sure!) hence all the more reason for your explanation in today's newsletter I suppose."
Linkfest, lap it up
Tired of traffic? If you are Elon Musk, commuting sucks so much that you plan to build a tunnel - Elon Musk says he's going to tunnel under his SpaceX factory soon. Does this fellow ever stop? Does he have large adrenal glands? One thing is for sure, he plans to continue to mix it up.
We have talked often about lower paying, labour intensive jobs under pressure from technology, this is another example - Is This Sewing Robot The Future Of Fashion? Fanuc are reportedly the largest seller of industrial robots, a Japanese listed business with a market cap of 4.6 trillion Yen, 39 billion Dollars nearly. Interesting, yes or no?
Do you use Facebook Messenger a lot? If so, expect ads like Instagram coming to your phone soon - Facebook begins showing sponsored posts in Messenger with small test in Australia and Thailand. We like Facebook a lot and continue to believe that they will monetise all of their platforms.
This happened so quickly, it almost takes your breath away. What are malls likely to look like in developed countries over the coming decades? Mall Owners Rush to Get Out of the Mall Business. We typically avoid these businesses for our clients.
Home again, home again, jiggety-jog. All we need now is a Roger vs. Rafa final (Venus and Serena are head to head Saturday)! T20, don't want to talk about that.
Sent to you by Sasha, Byron and Michael on behalf of team Vestact.
Follow Sasha, Michael, Byron, Bright and Paul on Twitter
078 533 1063
No comments:
Post a Comment