"So what is the message here? Don't be reactive, don't get spooked, remember what you are trying to do here. You are trying to share in the long term profitability of businesses, and not timing share prices from tops to bottoms and bottoms to tops. Own it, buy more if the stock prices go lower."
To market to market to buy a fat pig Stocks locally sank to levels, as a collective, not seen since February of this year. It has been a tough old year for equities. We will analyse the human element and reaction to equity markets a little lower. The All Share closed nearly a percent lower to just below 49 thousand points, resources were down around two and one-quarter of a percent on the session. The Rand was the highlight of the show, trading now a couple of percent away from the best levels of the year. Notwithstanding the ructions, the pending downgrades and political machinations that have threatened to derail the chugging and creaking freight train.
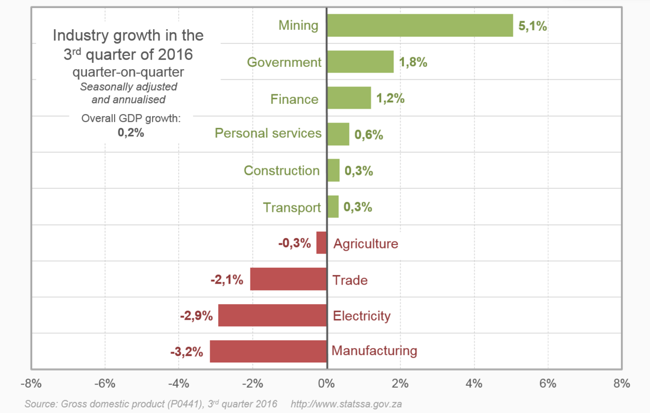
We can all do better, the third quarter GDP numbers (from a long-long time ago, around 70 days ago) were more than a little disappointing. All we want is efficient use of resources. Easier said than done I guess. The drought has seen the agricultural sector contract seven quarters in a row. Although small in its overall contribution to the bigger picture, it is a very important part to us all. We all need to wake up and eat, and if we need to import food, that results in pressures on Joe Consumer as a result of imported inflation. And inflation eats into the pockets of those who have the least. It is not just agriculture, which can point fingers to weather patterns, the manufacturing industry has contracted for 7 out of the last 11 quarters, you could argue that the industry is in a protracted recessionary environment. No doubt, that is what the numbers reveal.
Equally, utilities (electricity, water and gas) have contracted for 10 out of the last 11 quarters. With all due respect to the trumpeting Eskom about the lack of load shedding, it is as a result of lower demand that the lights are staying on, the numbers of the economy suggest that. And I guess they have been trying harder to make sure we stay powered up. We live in a country with wonderful people, who have wonderful ideas. And capitalism is alive and well, the best visible example of South African capitalism is the taxi industry. No regulation whatsoever for routes, self regulation. Hustling all day long for an extra buck, bending the rules and regulations. We can all agree that the industry needs to be a whole lot safer, the consumers would shout louder at the drivers on that score. All I am saying is that if incentives are put in place, and there is less government meddling, the informal industrial sector can be hugely successful here in South Africa, becoming a bigger part of the economy. I encourage it.
Herewith a graphic from StatsSA showing who were the leaders and who were the laggards when it came to our economy in the third quarter of this year. Here goes, courtesy of StatsSA:
It is very important to remember that the market is not the economy and the economy is not the market. Remember the other day in the post titled The $10 Billion Club, we established that only 6 out of the top 15 stocks listed here had primary listings in Joburg/Jozi, and were part of the 10 billion Dollar market capitalisation club. As such, with a skewed stock market here locally (when BATS or AB InBev goes up or down, does that mean the economy is good/bad?), it cannot be a fair reflection of the economy. There are few, if any businesses that could be a pure proxy for the local economy, if you can think of any, it would be much appreciated.
Over the seas and far away, across the ocean (the Atlantic that is), stocks rallied towards the end of the day. The Dow Jones Industrial Average rallied nearly one-fifth of a percent to close up shop at 19251 points ...... that is another record. The broader market S&P 500 rallied over one-third of a percent, to be near their all time high, reached a couple of weeks ago. The nerds of NASDAQ closed at five triple three, we are still around 70 odd points away from the highs, up 0.45 percent on the day was pleasing. Financials again moved the needle, up over a percent by the close. In recent weeks, for the first time in half a decade, financials are outperforming the broader market. The majors there are of course Berkshire, JP Morgan and Wells Fargo as well as Bank of America are all huge businesses starting to see some of their stodgy earnings projections turn north with the benefit of higher rates being a positive for their business.
Nike took a knock, after being the top stock in the Dow the session before, they were the worst performer, by quite some margin. Nike are by far and away the worst performing stock in the Dow Jones this year, down 19 percent. The top performing stock in the Dow Jones Industrial average is Caterpillar, up an astonishing 40 percent YTD. Over five years CAT is flat (as a pancake), the stock is down 0.8 percent. Nike is up 110 percent over that time. Ten years, CAT is up 55 percent, Nike is up 314 percent. When I reverse and have a look at data from late 1980 to present day, Caterpillar is up 1140 percent, the shares of Nike (thanks Google Finance for this info) are up 29318 percent. The S&P 500 is up 1474 percent over that time, it would have been better to have owned the index over Caterpillar. What is the moral of the story? Hindsight is an exact science.
It is never *nice* to see the value of the shares that you hold sink to levels that make you feel uncomfortable. Feeling like you are close to sitting on a cactus plant. There are many analogies that people use for the declining value of their equities portfolios, most of these involve some sort of horror movie scene, with explosions, crashes and dismembered body parts everywhere. Part of investing is the ability to recognise your "fears". For instance, if you buy and own Walmart, you are never going to expect revenues to plunge or rise in the high teens.
It is a steady business that delivers year in and year out, people shop there for value. And there are always people looking for value. So ..... when the Walmart share price fell from nearly 90 Dollars a share in January of 2015 to 56 Dollars by November, down 35 percent for the year, did that mean that Walmart sold less, reported lower profits? No. Share price performance and actual reported numbers have a close correlation, they are not one and the same. In fact, when the share price was 35 percent lower, sales reported are not that different from the years prior.
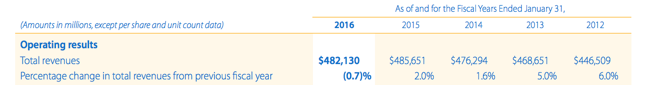
The share price over the five year period saw a 17 percent increase. There have been multiple highs and lows. The dividends have added another 15 percent. The dividends have given you as much as the stock returns, more or less. Yet when "investors" talk of returns, they will not refer to these wonderful and incremental returns, that if reinvested, generate higher returns in time. It takes time, even in the face of increasing competition from online competitors, to realise that things change, they also stay the same.
I have written to clients who share the same concerns, that the value of their portfolios are obviously lower than the last high water mark. Our message has always been consistent. Here are a few excerpts that will no doubt help, in the same way that a visit to the doctor is helpful to tell you that everything is going to be ok.
What you have complete control over as an investor is what you want to own, how you view their prospects over many years ahead. You have control over how long you are willing to own a business. You have control over your ability to stomach steep losses and equally to avoid temptations to sell when a stock does well. The longer you own a specific stock, the temptation arrives when you feel you must rebalance, when in truth you must use the dividend flow generated to rebalance over a few years.
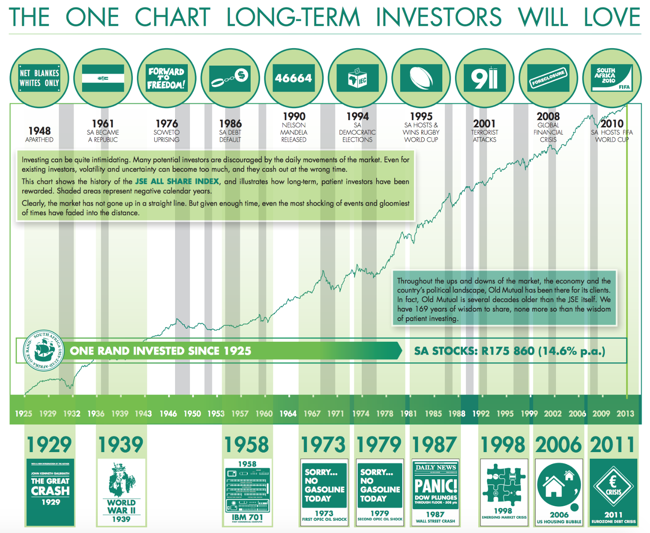
And then an Old Mutual graph below went with another answer to concerns about the equities market. I think that it is pretty self explanatory and it takes all the events, global and local and puts in the returns over that time, of the overall market.
... these are companies that constantly evolve and are likely to continue to report higher revenues on sustained margins (or increased margins) in the years to come. Here is a fairly "dated" Old Mutual graph, you get the picture however, in amongst all those squiggles moving down and to the right, there are many more moving up and to the right. And we can count many events, both political, local and geopolitical (as well as financial) that can trash investments, the trick is to remind yourself you own companies, not share prices.
And then another:
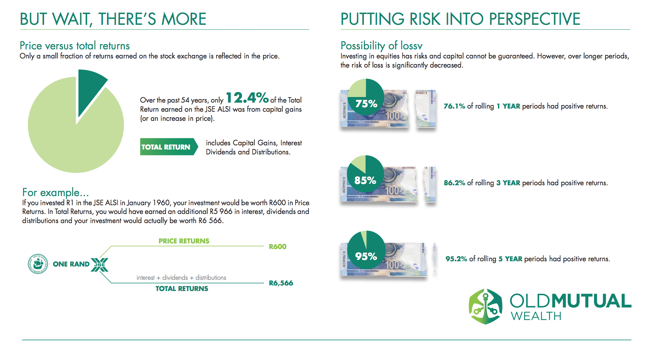
So what is the message here? Don't be reactive, don't get spooked, remember what you are trying to do here. You are trying to share in the long term profitability of businesses, and not timing share prices from tops to bottoms and bottoms to tops. Own it, buy more if the stock prices go lower. As I told a younger, exceptionally bright Sandtonite (who is a saver and not a spender): "You should ironically as a youngster buying equities hope for lower prices over time, so that whilst you are adding, you get cheaper prices."
Linkfest, lap it up
Here is a look at what is in the pipeline from Facebook. There are some cool ideas and some gimmicks - Mark Zuckerberg reviewed the coolest stuff Facebook’s engineers are working on
I can see the value in having indoor mapping, particularly when you are traveling - Apple secretly acquired a Finnish company to help it map indoor spaces. Imagine going to a big sporting event, punching your seat number into your cellphone and then it directing you to it.
The minimum wage debate is something we are having in South Africa at the moment. Seattle has a different workforce composition to that of South Africa and a different growth rate but this is interesting data none the less - Seattle Minimum Wage Experiment is Over.
Home again, home again, jiggety-jog. Stocks have started better. What a surprise (Muriel's wedding, the old man), stocks in Europe are also indicated better. Steinhoff has opened up over three percent as their results have attracted the buyers. It certainly looks attractive at these levels. We will have a write up tomorrow on these numbers.
Sent to you by Sasha, Byron and Michael on behalf of team Vestact.
Follow Sasha, Michael, Byron, Bright and Paul on Twitter
078 533 1063
No comments:
Post a Comment